Queue Backlog Monitoring: Know When Background Processing Falls Behind
Detect growing queues, worker capacity loss and delayed background jobs before they affect customers. Monitor queue depth, message age, processing throughput and healthy worker counts to identify silent failures. Set practical alert thresholds and keep emails, reports, uploads and other background processes running reliably.
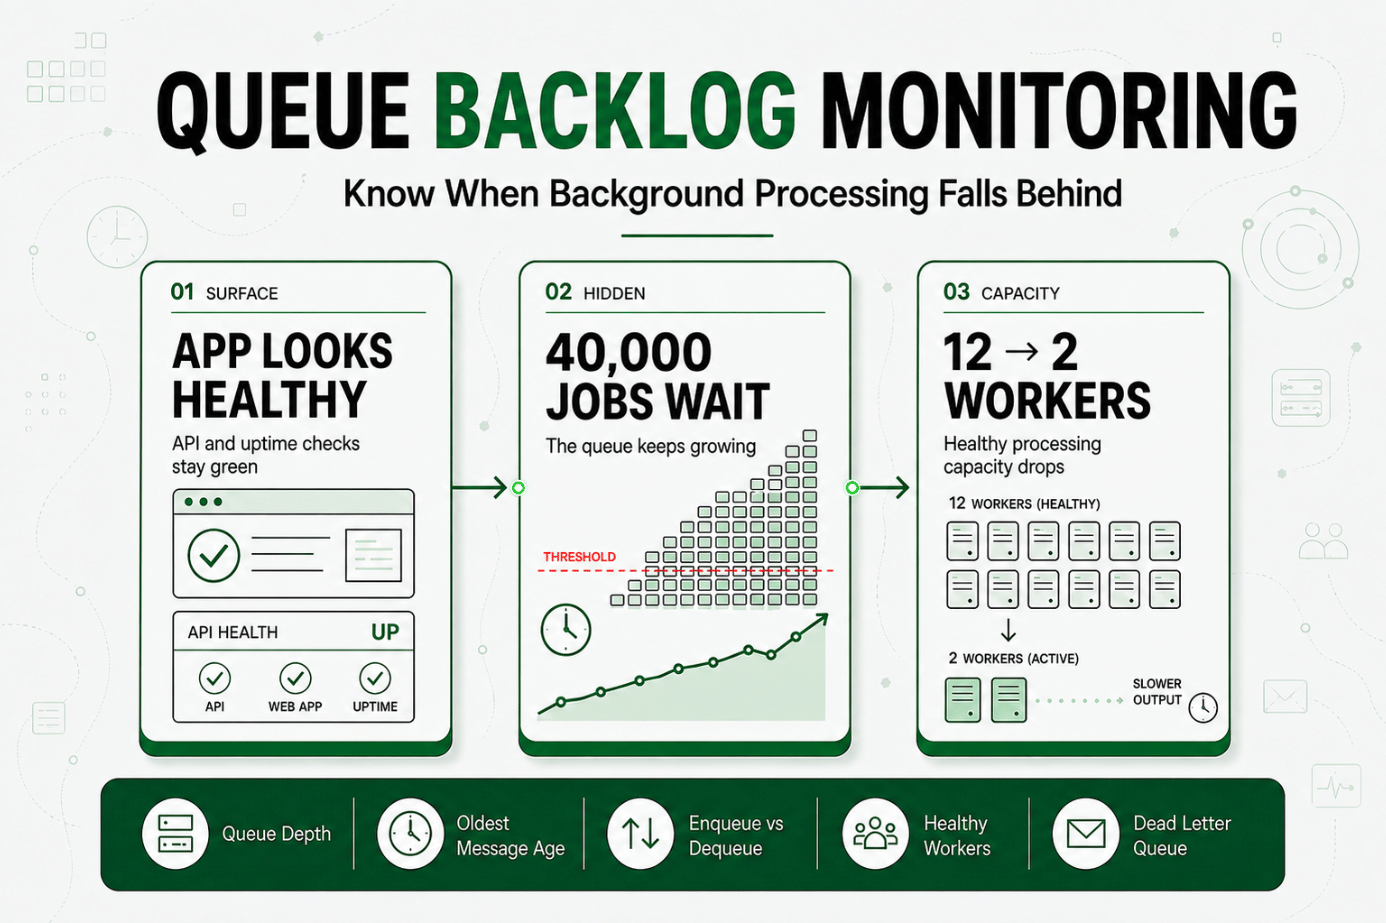
The API is responding. The web app loads fine. Every uptime check is green. And underneath all of it, forty thousand background jobs are sitting in a queue, untouched, because a worker deployment quietly cut healthy capacity from twelve instances down to two three hours ago. None of your standard monitoring has any way of seeing this, because from the outside, the request-response path looks exactly as expected.
Queue backlog monitoring exists to close this specific, common gap. A background processing system can be falling badly behind while every surface level check server uptime, API response codes, load balancer health continues to report everything as fine, because none of those checks were ever designed to look at the one layer actually causing the problem. A broader website monitoring platform becomes much more useful when these background-processing signals are monitored alongside public endpoints.
Why Queue Backlog Monitoring Matters to Reliability and Customer Experience
A large share of what modern applications do doesn't happen synchronously. Sending emails, generating reports, processing uploads, syncing data between systems, running webhooks all of it typically runs through a queue, decoupled from the request that triggered it. When that background layer degrades, the application in front of it can remain fully responsive the entire time, because the request response cycle and the actual processing of that request are two separate systems with two separate failure modes. The RabbitMQ monitoring guidance similarly recommends observing both infrastructure and application-level queue metrics rather than relying on node availability alone.
Asynchronous processing reliability, in the way that actually matters to customers, isn't just about whether the queue accepts new messages. It's about whether those messages get processed within an acceptable amount of time, by a worker pool with enough healthy capacity to keep pace with demand. A queue that's accepting jobs but not clearing them produces exactly the same broken experience for the customer as a queue that's rejecting jobs outright the confirmation email never arrives either way.
The Operational Risk of Not Monitoring Queue Backlog Directly
Teams that rely solely on request response monitoring, without an explicit check on queue depth and processing speed, tend to miss a specific category of failure that sits invisibly between "the app is up" and "work is actually getting done":
- Worker capacity loss looks nothing like a server failure. When workers hang, crash without restarting, or get quietly reduced during a bad deployment, requests to the application keep succeeding normally, while the pool actually processing background work shrinks without triggering any typical health check.
- A growing backlog degrades the experience long before it causes an outright failure. A queue that's a few minutes behind doesn't trigger an uptime alert, but it directly and measurably delays every user facing outcome that depends on that background job completing.
- A queue can accept messages while failing to make progress on them. Basic connectivity checks that only confirm a message was successfully enqueued don't verify that anything downstream is actually consuming and completing that work.
- Dead-lettered jobs are invisible to a main queue only health check. Work that fails repeatedly and gets routed to a dead letter queue disappears from the primary queue's metrics entirely, even though that work was never actually completed.
Without a dedicated worker lag alert verifying actual processing throughput and backlog trend, teams typically discover these issues the way they discover most background layer failures: through a spike in customer reported delays, well after the underlying backlog began building, and often after considerable time spent incorrectly investigating the API or database layer first.
How Queue Backlog Monitoring Works: Key Signals, Thresholds, and Diagnosis
What Queue Backlog Monitoring Actually Checks
A well designed backlog monitor goes beyond simply confirming the queue is reachable. It typically tracks the count of unprocessed messages, how fast that count is growing or shrinking, and how long the oldest unprocessed message has been waiting verifying not just that the queue exists, but that work is actively flowing through it at an acceptable rate. These signals align with the Amazon SQS monitoring metrics, including visible-message count and the approximate age of the oldest message.
Job Queue Depth
Job queue depth is the raw count of messages or jobs waiting to be processed at any given moment. On its own it's a limited signal, since a queue holding a few thousand items can be perfectly healthy if it clears them within minutes, or already in serious trouble at a few hundred if the oldest one has waited hours. Depth is most useful when read as a trend rather than a single number. Google Cloud's Pub/Sub subscription monitoring guide also highlights unacknowledged-message volume and oldest unacknowledged-message age as key health indicators.
Worker Lag and Throughput
A worker lag alert typically compares how fast messages are arriving against how fast they're being consumed. When enqueue rate consistently outpaces dequeue rate, the backlog will keep growing regardless of its current size, which makes this ratio a more forward looking signal than depth alone. For worker-based systems, the Celery monitoring and management guide provides additional operational context for observing worker and task activity.
Delayed Background Jobs in Context
Delayed background jobs are most useful to understand in relation to a concrete SLA. A monitor watching oldest message age directly against the time customers actually expect a result "processed within 15 minutes" turns an abstract backlog number into a clear, actionable signal for whether that commitment is at risk. This is the same measurement-to-commitment relationship described in the Statixoup guide to SLA vs SLO vs SLI.
Key Signals to Track
| Signal | What It Catches |
|---|---|
| Queue depth over time | General backlog trend, useful mainly as a growth/shrink signal rather than a static number |
| Oldest message age | Worst case customer facing delay, often more actionable than depth alone |
| Enqueue rate vs. dequeue rate | Whether the backlog is structurally growing regardless of current size |
| Active healthy worker count | Capacity loss from crashed, stuck, or scaled down workers |
| Dead letter queue volume | Work that's failed repeatedly and been abandoned rather than delayed |
Setting Thresholds
Backlog growth thresholds are most useful when tied to sustained trend growing for a set number of consecutive minutes rather than a single depth number applied universally, since normal queue depth varies meaningfully by time of day and deployment cycle. Oldest message age thresholds are often more effective when set directly against the processing SLA customers actually experience, rather than an arbitrary internal number disconnected from what users are waiting on.
Diagnosis: Isolating a Backlog Layer Failure
When customer facing symptoms appear delayed emails, stale statuses the fastest way to confirm or rule out background processing as the cause is checking whether queue depth, oldest message age, or active worker count show a corresponding, correlated change during the same window. A clear correlation strongly suggests the queue layer, the absence of one points the investigation elsewhere.
A Practical Production Scenario
A SaaS platform processes uploaded files asynchronously a worker pool pulls jobs from a queue, generates thumbnails, extracts metadata, and writes results to storage. The web app stays fully responsive throughout, since uploads are accepted immediately and processed in the background.
Behind the scenes, a routine dependency upgrade in the worker service introduces a subtle bug: a certain file type causes the worker to hang instead of failing cleanly. Each hung worker never returns to the pool, and over three hours the healthy worker count silently drops from twelve to two, while upload volume stays completely normal. From the application server and load balancer's perspective, nothing looks unusual, since the app itself is handling upload requests exactly as expected.
Customer facing symptoms stale processing statuses, missing thumbnails begin appearing the next morning before any infrastructure level alert fires, since infrastructure monitoring was never watching worker capacity or backlog growth specifically. Once a dedicated backlog monitor correlating active worker count with queue depth is added, the team can see the exact moment healthy capacity began dropping, well before the backlog became a multi hour cleanup, and fixes the underlying bug for the remainder of the rollout.
Recommended Monitor Setup
- Configure a backlog growth monitor that alerts on sustained queue depth increase, not just an absolute ceiling.
- Monitor oldest message age directly against your processing SLA, catching worst case delay independent of overall depth.
- Track active healthy worker count as a distinct signal, alerting when it drops below expected minimum capacity.
- Monitor dequeue rate as a rolling baseline, catching "workers are up but slow" independent of outright worker crashes.
- Watch dead letter queue volume explicitly, since abandoned work won't show up in main queue depth at all.
Best Practices for Queue Backlog Monitoring
Track Trend, Not Just a Snapshot of Depth
A single depth reading says little on its own. Watching whether the backlog is growing, shrinking, or holding steady over a sustained window is a far more reliable signal of whether processing is keeping pace with demand.
Tie Oldest Message Age Thresholds to Your Actual SLA
Setting the age threshold to the same processing time your customers actually expect, rather than an arbitrary internal number, keeps the alert directly tied to real customer impact.
Monitor Worker Health Alongside the Queue Itself
Watching queue depth without watching the consumer pool means seeing the symptom without the cause. Active worker count and per worker throughput turn a vague "backlog is growing" into an actionable "capacity dropped."
Don't Let the Dead Letter Queue Go Unwatched
A growing dead letter queue means work isn't delayed, it's being abandoned. It deserves its own alert rather than being assumed to show up somewhere in the main queue's numbers.
Set Growth Thresholds Relative to Normal Daily Patterns
Queues with predictable daily traffic benefit from thresholds compared against a rolling baseline for the same time window, rather than one static number applied at all hours.
Correlate Backlog Signals With Downstream Customer Facing Symptoms
Reviewing backlog growth alongside actual delayed job complaints or stale status reports makes it much faster to confirm whether a broader symptom traces back to background processing specifically.
Common Mistakes in Queue Backlog Monitoring
Mistake 1: Only Checking Queue Depth, Never Message Age
Why it happens: depth is the simplest number to expose and alert on.
What to do instead: track oldest message age alongside depth, since a moderate backlog with one very old message often signals a stuck job that depth alone won't reveal.
Mistake 2: Using a Single Static Depth Threshold at All Hours
Why it happens: a fixed number is simpler to configure than a trend or baseline aware threshold.
What to do instead: alert on sustained backlog growth or deviation from a rolling baseline, so normal daily peaks don't get flagged as false incidents.
Mistake 3: Watching the Queue Without Watching the Workers
Why it happens: the queue itself feels like the natural place to monitor, while consumer health is treated as a separate concern.
What to do instead: track active healthy worker count and per worker throughput directly, since capacity loss is one of the most common root causes behind backlog growth.
Mistake 4: Ignoring the Dead Letter Queue
Why it happens: attention concentrates on the main queue, since that's where active processing happens.
What to do instead: monitor dead letter queue volume explicitly, since failed and abandoned jobs won't show up in main queue depth at all.
Mistake 5: Routing Every Backlog Alert to a General On Call Rotation
Why it happens: it's simpler to have one alert destination than to route by queue ownership.
What to do instead: route alerts to the team that actually owns the specific queue's consumers, since worker capacity issues and downstream dependency issues usually need different responders.
Mistake 6: Treating Background Processing as "Fire and Forget"
Why it happens: teams instrument APIs and web servers thoroughly but assume async jobs will simply get processed eventually.
What to do instead: apply the same monitoring discipline to background processing that's applied to customer facing endpoints, since that assumption is exactly what lets backlog problems go unnoticed for hours.
Start Monitoring the Layer Behind Most Silent Delays
A healthy API and a responsive web app say nothing about whether the background work behind them is actually getting done. That gap is exactly where worker capacity loss and growing backlogs hide until customers are already affected. Explore more website monitoring and incident-management guides to connect queue health with the rest of your reliability workflow.
Start a 30 day Statixoup beta and configure queue backlog monitoring that checks real processing throughput and worker capacity, not just whether the queue accepts new messages. The next background processing failure won't get to hide behind a responsive looking app.